Data processing & analysis platform
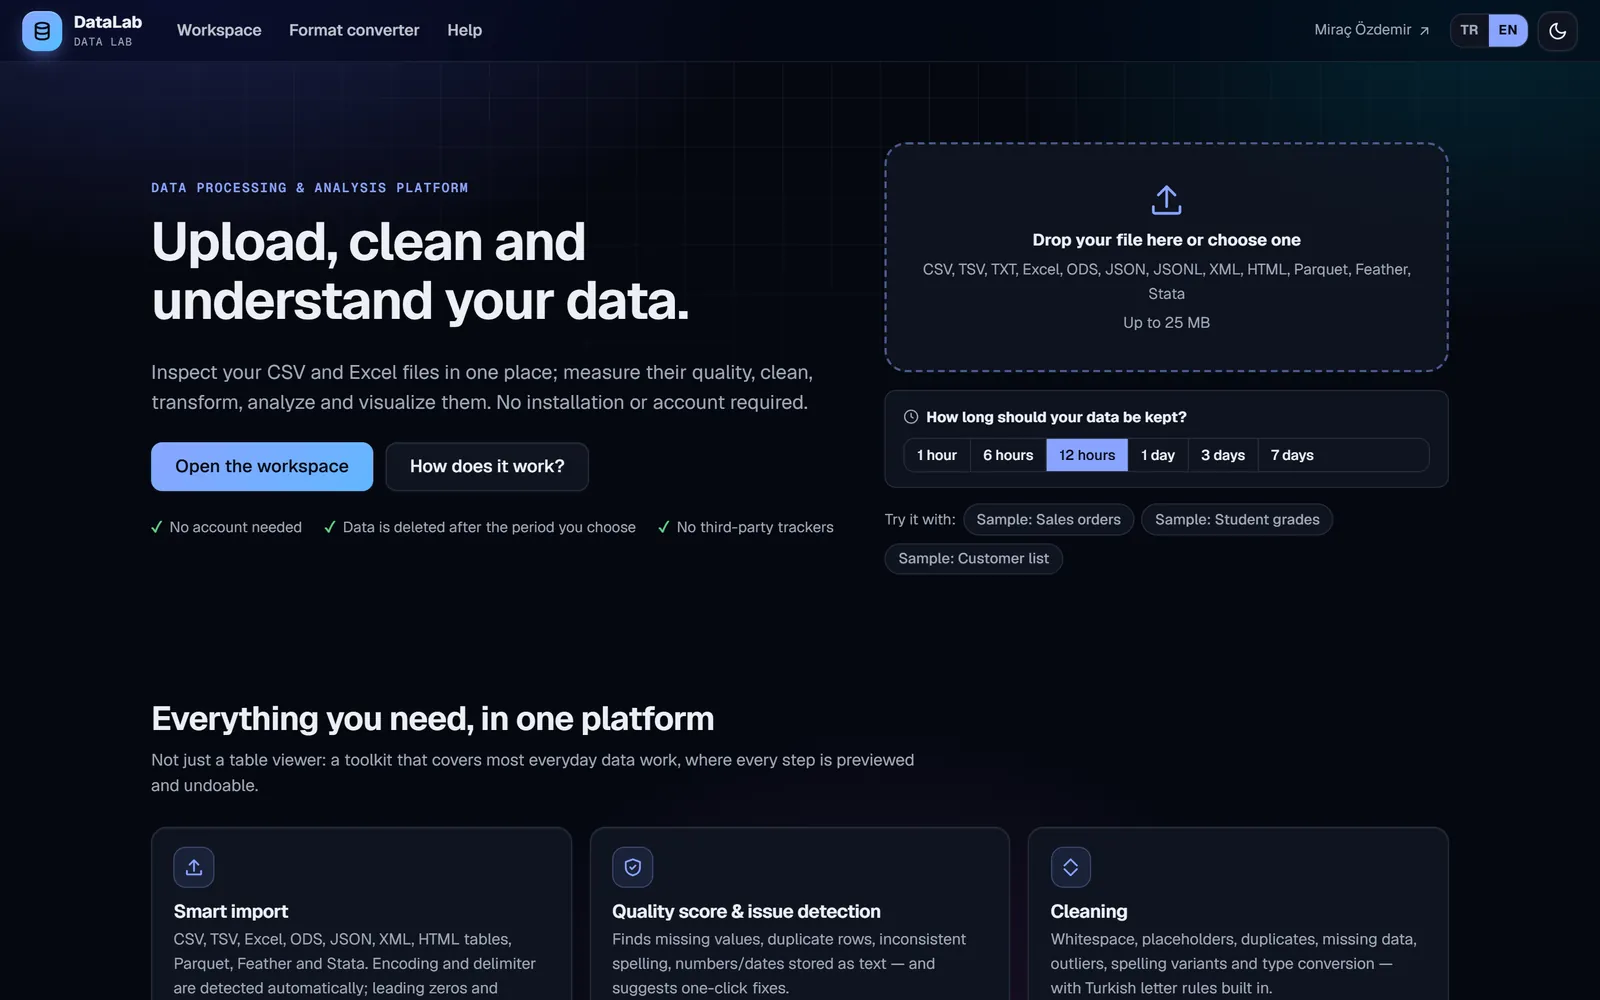
Clean, analyze and visualize your Excel and CSV data in the browser
DataLab brings most everyday work with tabular data into one screen: import, quality score, cleaning, transformation, statistics, charts, dashboards, SQL and export. Every operation is previewed first, shows what changes and can be undone in one click.
- No account needed
- Data is deleted when your chosen period ends
- No third-party trackers
- Turkish and English
01 / 08
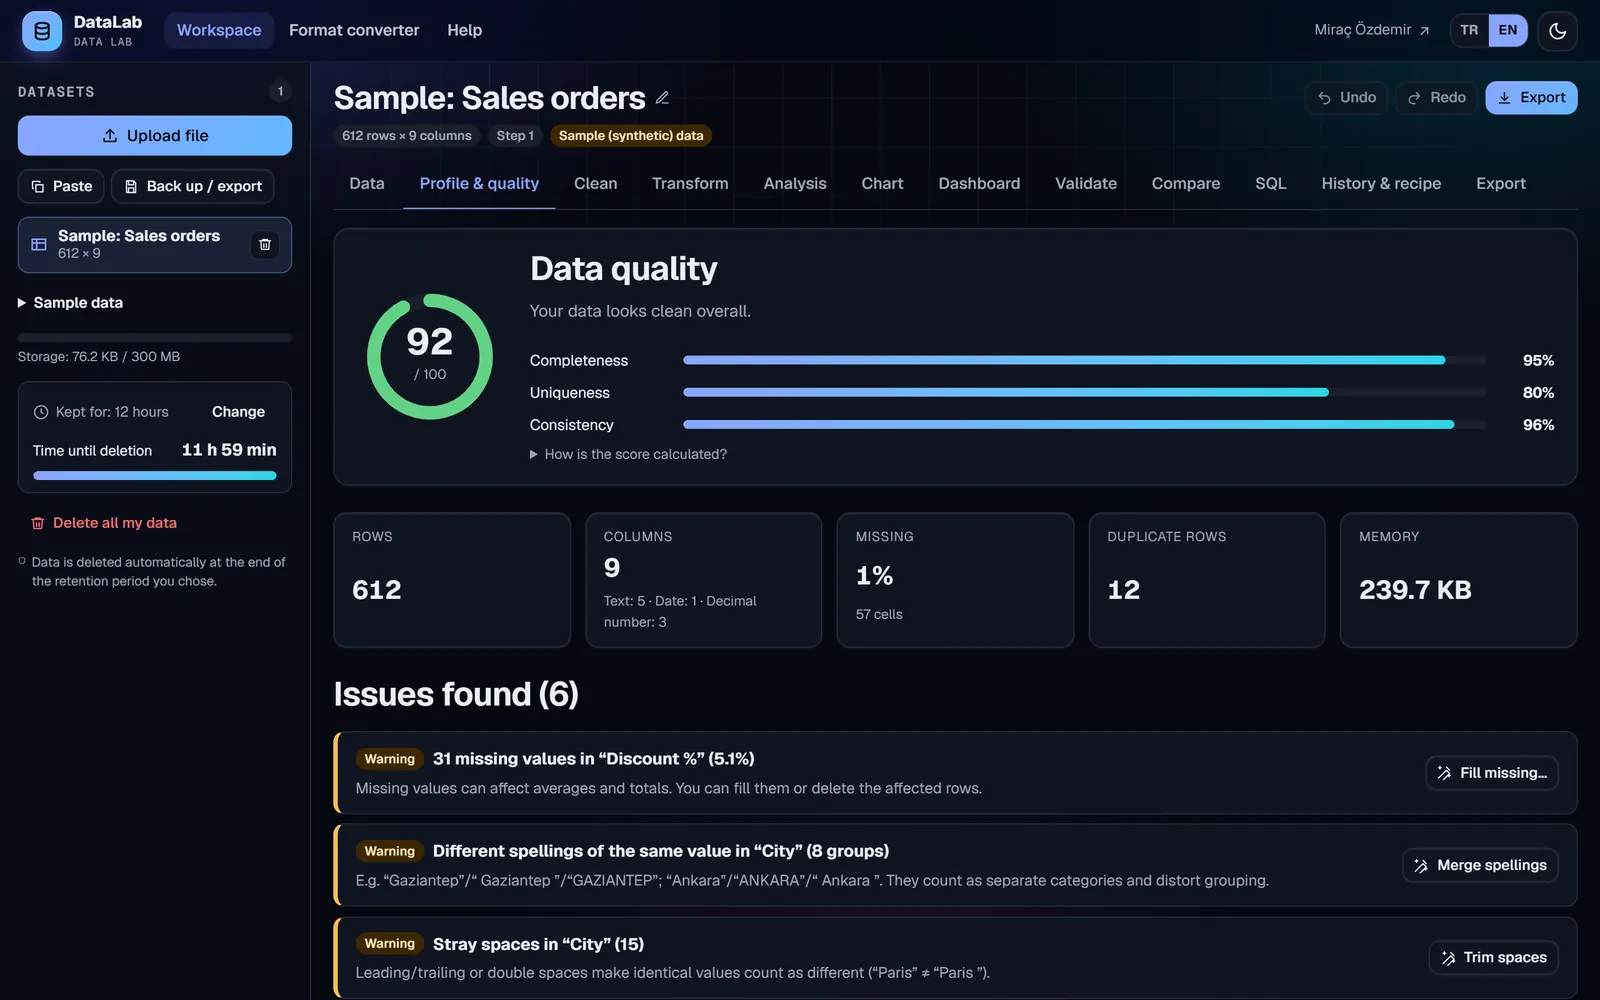
Quality score and profile
Screenshots taken from the live app
- import formats
- 12
- cleaning & transformation operations
- 50+
- chart types
- 23
- analyses & statistical tests
- 25
Everything you need for your data, on one platform
Not just a spreadsheet viewer: an end-to-end workspace from data preparation to reporting.
Smart import
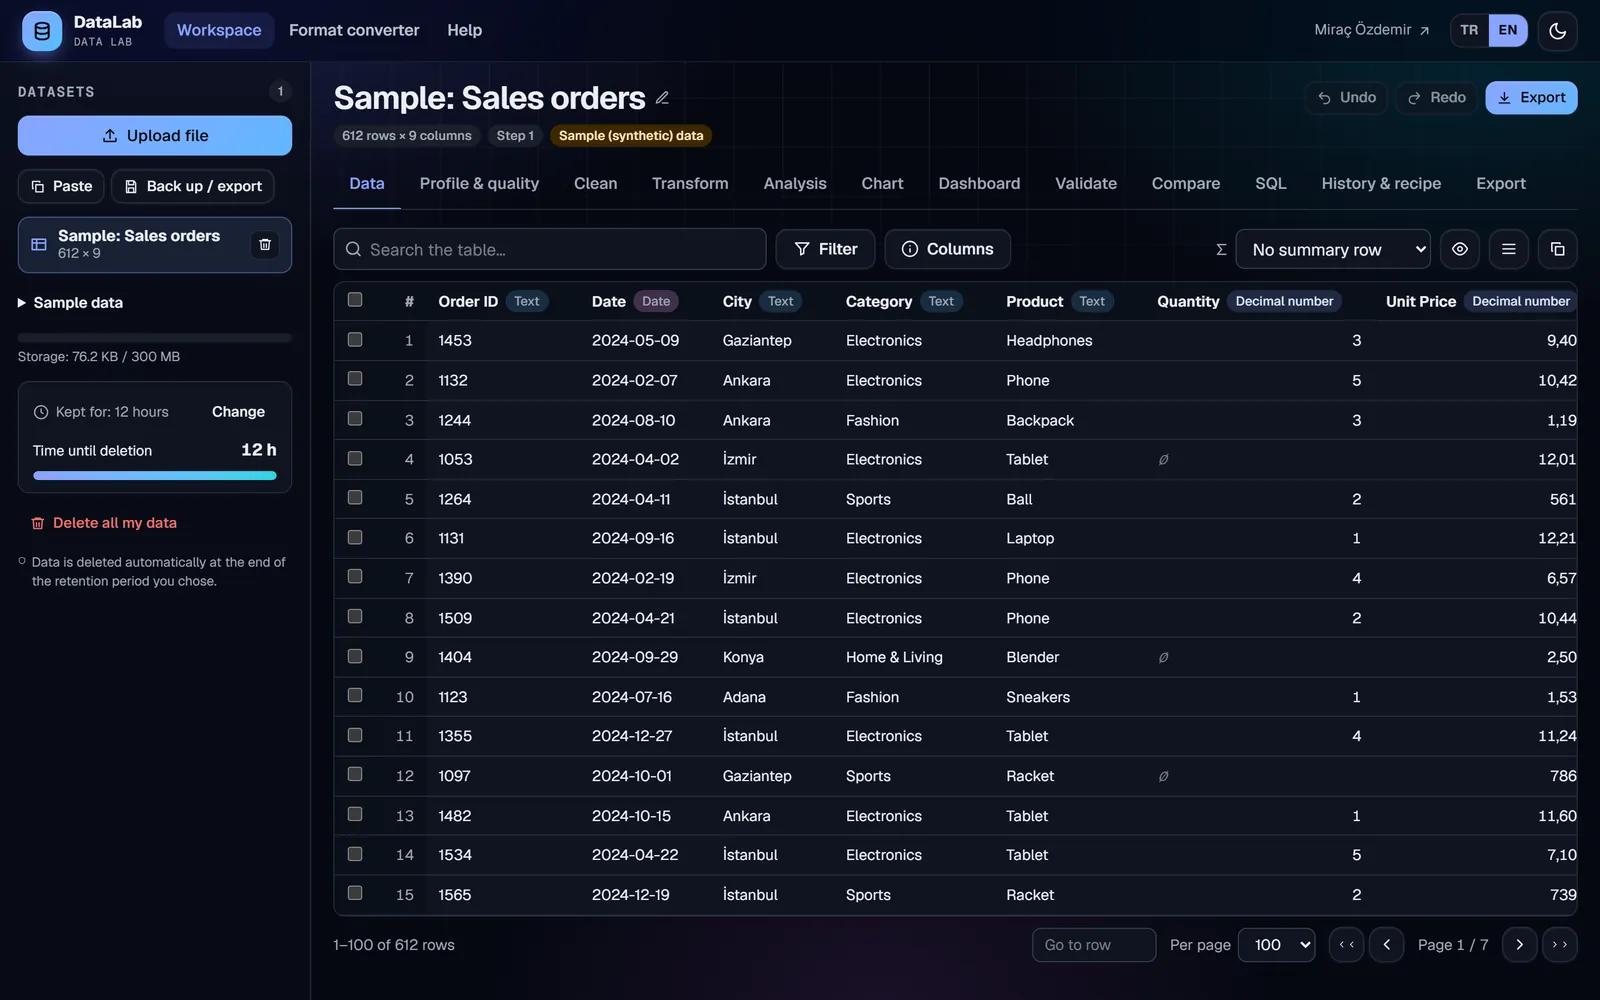
CSV, TSV, Excel, ODS, JSON, XML, HTML tables, Parquet, Feather and Stata. Encoding and delimiter are detected; leading zeros and ambiguous dates stay intact.
Quality score
Finds missing values, duplicate rows, inconsistent spellings and numbers or dates stored as text, and suggests a fix.
Cleaning
Whitespace, placeholders, duplicates, missing data, outliers, fuzzy spelling variants and personal data masking.
Transformation
Filters, formula columns, grouping, pivot, fuzzy joins, filling date gaps, clustering and PCA.
Statistics
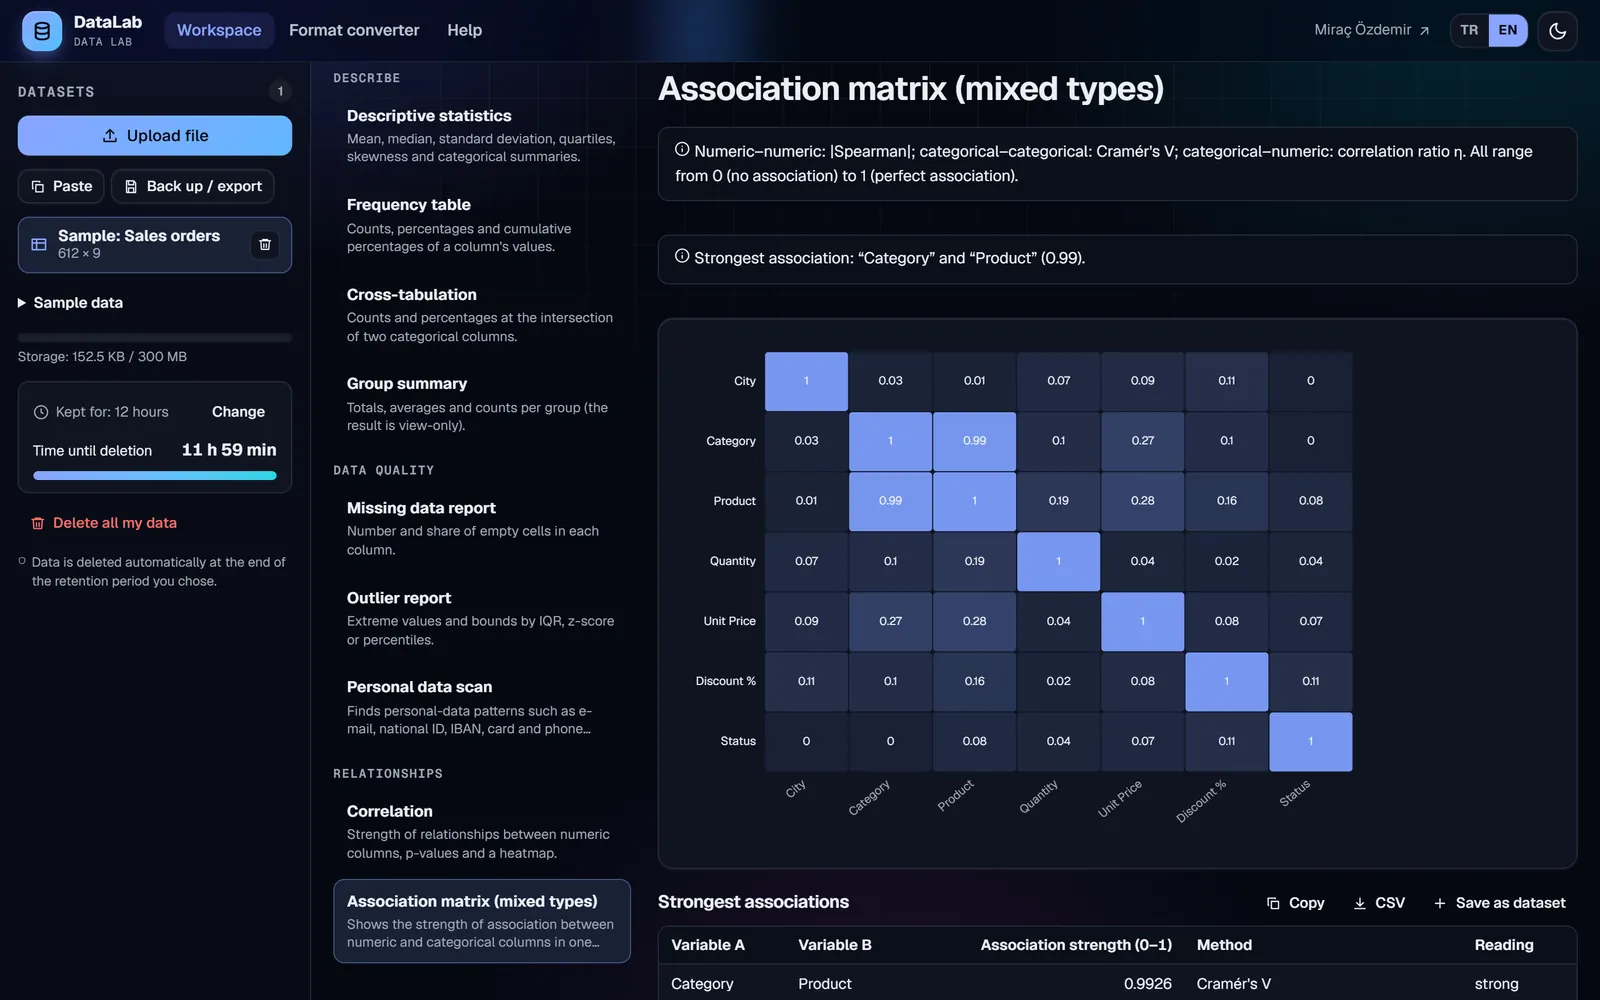
Descriptive statistics, t-test/ANOVA, chi-square, A/B tests, regression, time series forecasting, RFM and Pareto/ABC.
Visualization
Combo and dual-axis charts, small multiples, colour-blind friendly palettes; SVG and PNG output.
Dashboards and KPIs
Pin key charts and KPI cards to a dashboard; share it as HTML or PDF.
SQL queries
Read-only queries that join several datasets; your data never changes.
Compare and validate
See added, removed and changed records between two files cell by cell; validate with rules.
Export and recipes
Export to 13 formats; save repeated work as a recipe and apply it to new files in one click.
01Check
Upload a file and see the health of your data at a glance
DataLab profiles your data on every upload: row and column counts, types, empty cells, duplicate rows and inconsistent spellings. Issues are ranked by severity, each with a one-click fix next to it.
- Quality score from 0 to 100: completeness, uniqueness, consistency
- Understands Turkish casing and whitespace differences
- Catches numbers and dates stored as text
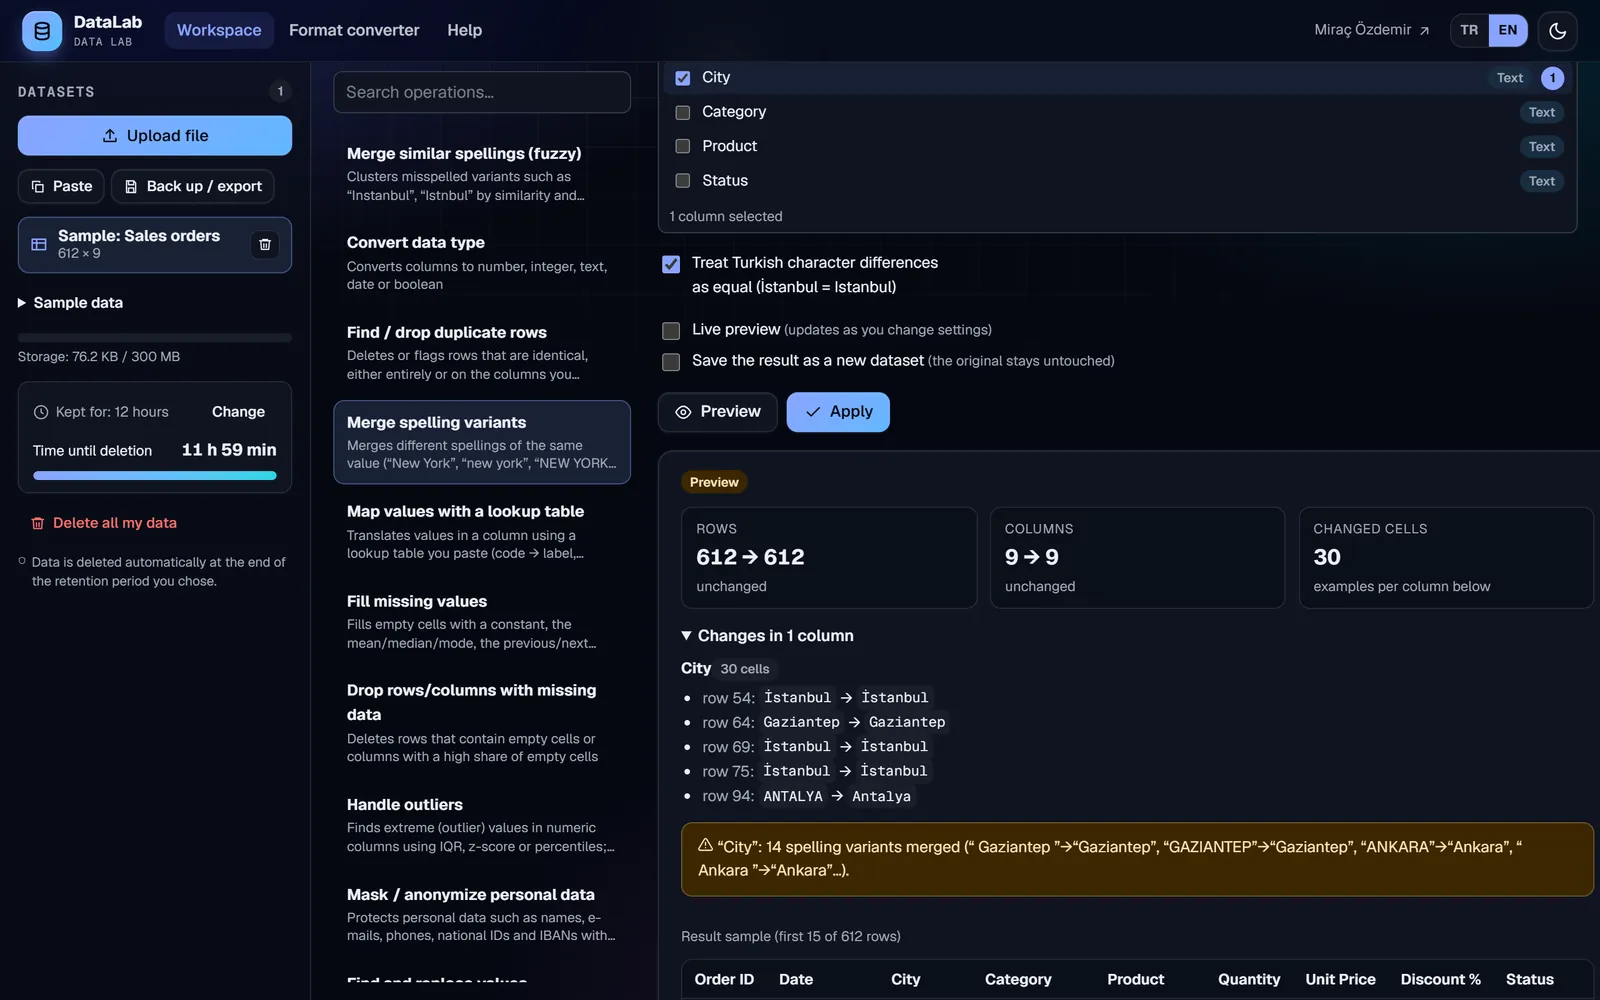
02Edit
Preview, verify, apply: no change comes as a surprise
Every cleaning and transformation step is previewed first. You see how many rows and cells change, with sample values. Don't like the result? Undo it; every step stays in the history.
- 50+ operations, each one reversible
- Option to save the result as a separate dataset
- Save steps as a recipe and apply them to another file
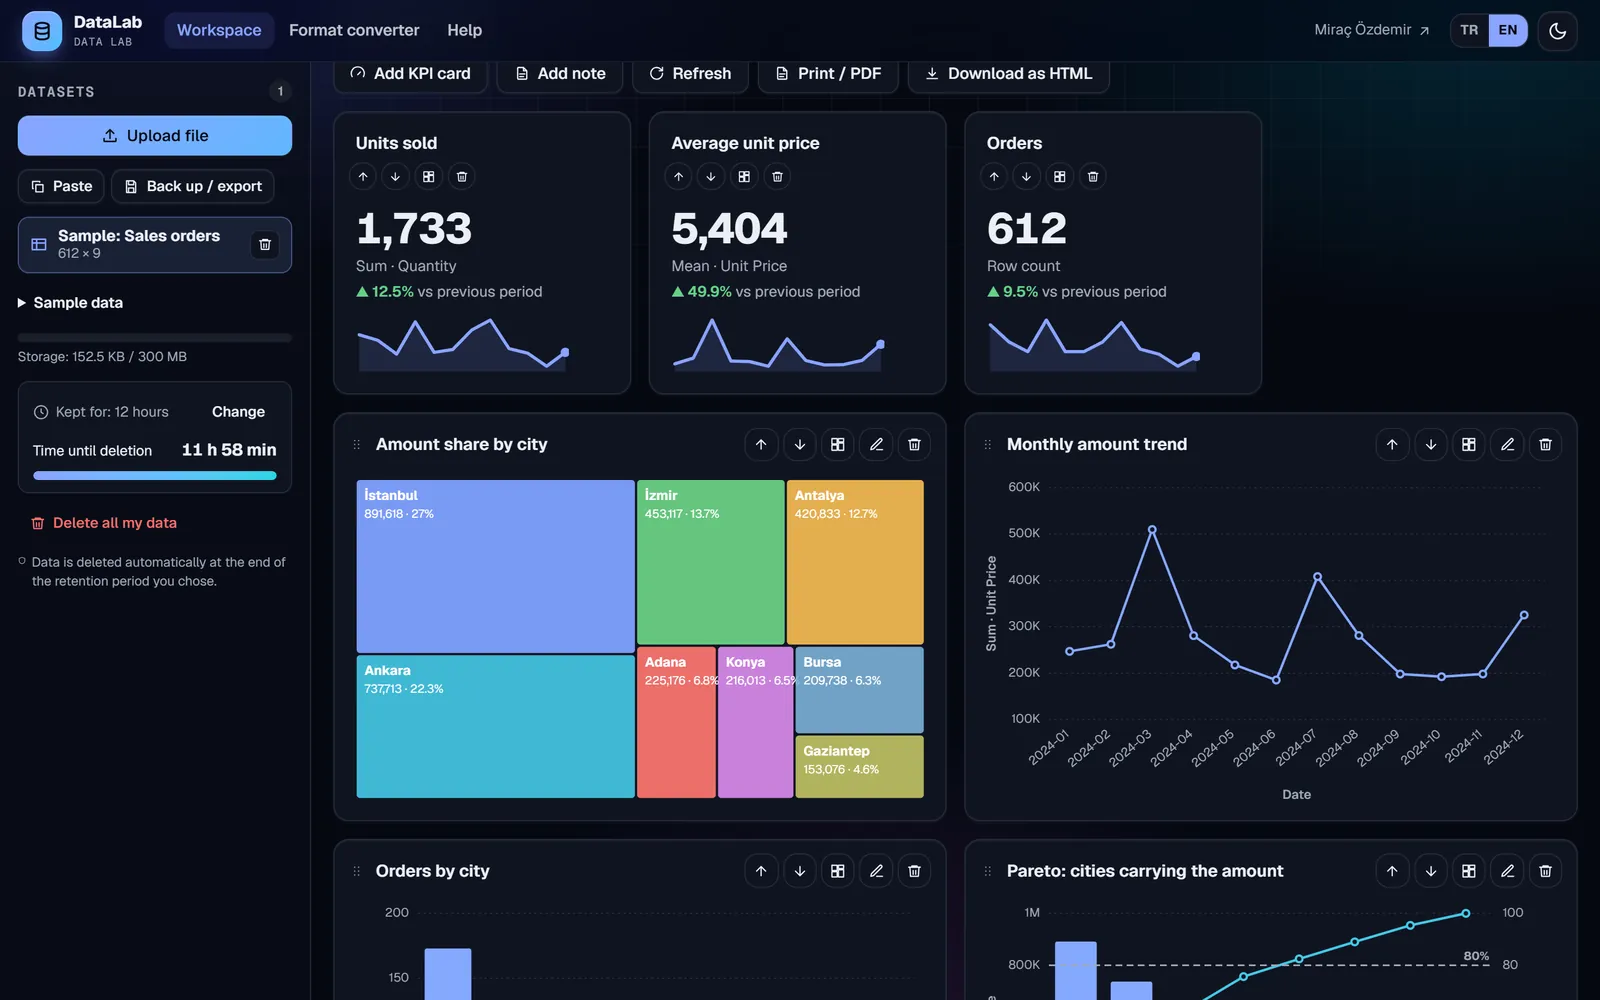
03Understand
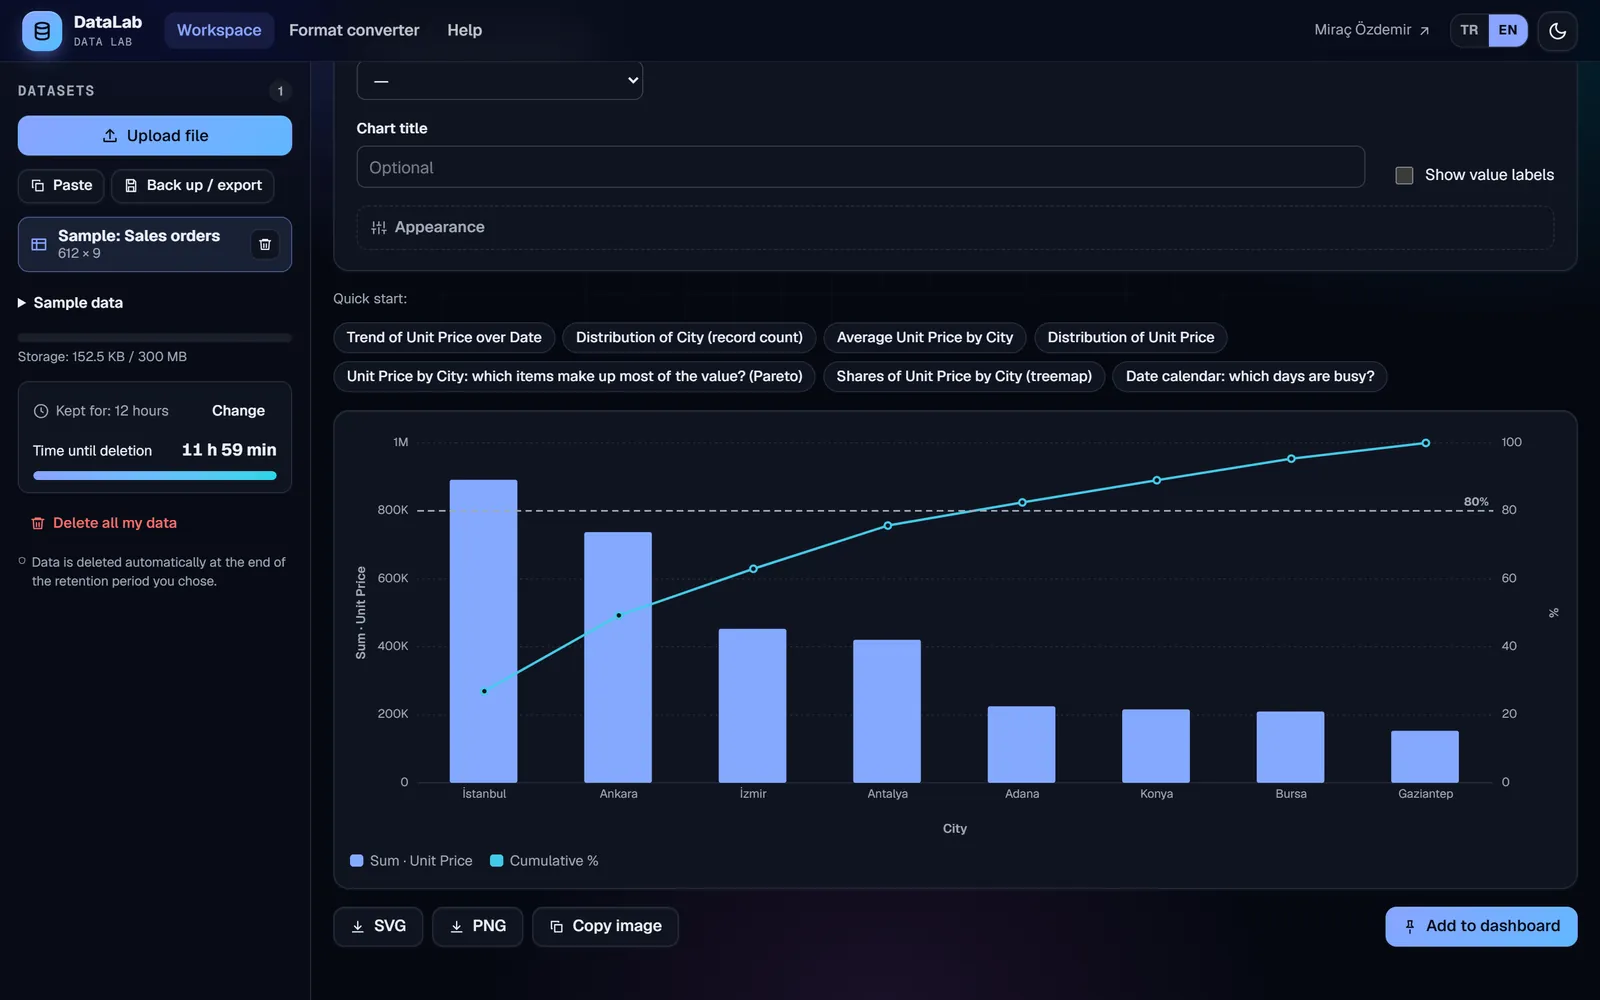
From charts to a KPI dashboard in a few clicks
Quick-start suggestions prepare the chart that fits your data; you just pick one. Pin the charts you like to a dashboard together with KPI cards. The dashboard redraws from current data and can be shared as HTML or PDF.
- 23 chart types and small multiples
- KPI cards with change against the previous period
- SVG, PNG, HTML and PDF output
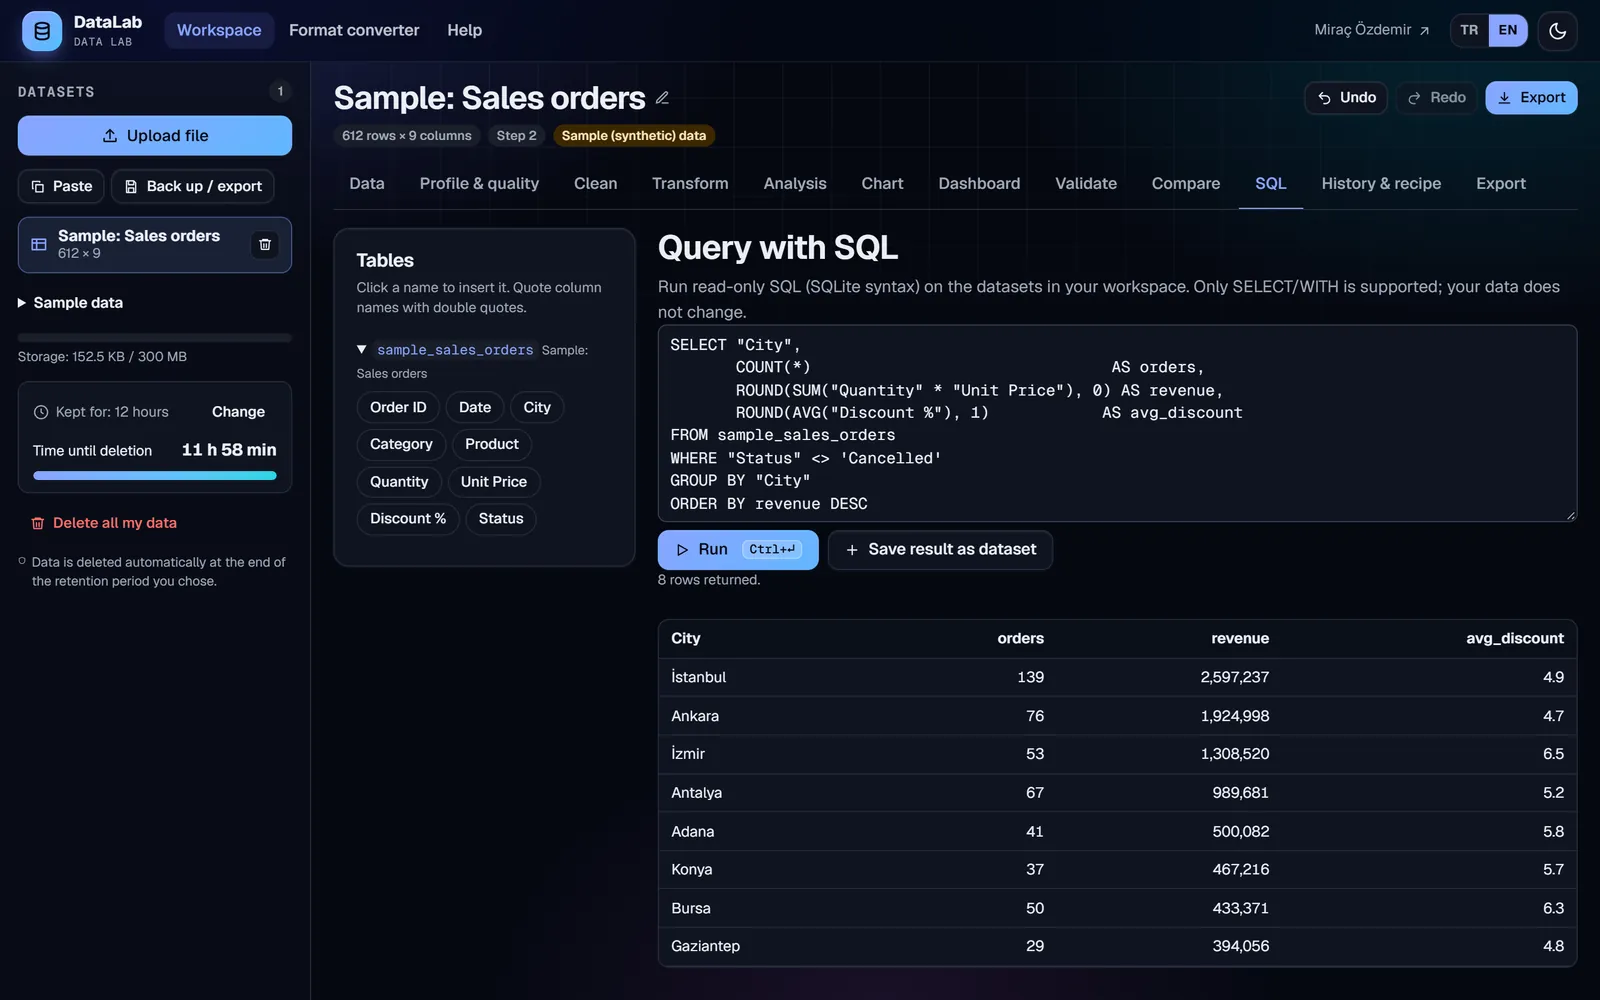
04Query
Full power if you know SQL, ready-made analyses if you don't
Your datasets are ready as SQL tables. Join several files, group and sort, and turn the result into a new dataset in one click. If you don't know SQL, 25 ready-made analyses do the same work through forms.
- SQLite syntax, SELECT/WITH only
- Runs safely with time-outs and resource limits
- Export the results or turn them into a chart
Results in four steps
Upload
Drop or paste a file; confirm the settings in the preview.
Check
See the state of your data in the profile and quality report.
Edit
Preview, verify, apply. Every step can be undone.
Share
Export charts, dashboards, reports and the clean file.
Who is it for?
Accounting and finance
Merge bank and ERP exports, remove duplicate entries and find reconciliation differences.
Sales and e-commerce
Turn order exports into a revenue dashboard, Pareto/ABC analysis and RFM customer segments.
Human resources
Standardize staff lists and share them safely with personal data masked.
Research and academia
Clean survey data and get t-tests, ANOVA, chi-square and regression with plain-language interpretation.
Education
Analyze grade sheets and show distributions and pass rates with charts.
Public sector and NGOs
Combine open datasets, convert their formats and get them ready for reports.
Privacy is not a feature, it is the baseline
Your data may be personal, commercial or confidential. That is why DataLab works with the least data for the shortest time.
- Files live in an isolated workspace with a random ID that only you can reach.
- You choose the retention period (1 hour – 7 days); data is deleted automatically when it ends.
- File contents and file names are never written to logs.
- Protected against zip bombs, oversized uploads and Excel formula injection.
- Only functional cookies; no ads and no third-party trackers.
Supported formats
Import
- CSV / TSV
- XLSX
- XLS
- ODS
- JSON
- JSONL
- XML
- HTML
- Parquet
- Feather
- Stata
- FWF
Export
- CSV
- TSV
- XLSX
- JSON
- JSONL
- Markdown
- HTML
- SQL
- XML
- Parquet
- Feather
- Stata
- LaTeX
Free limits
- upload per file
- 25 MB
- rows per dataset
- 1 million
- cells
- 3 million
- datasets at the same time
- 8
Frequently asked questions
Is DataLab free?
Yes. DataLab is completely free; you don't need to create an account, enter card details or install anything.
Where is my data stored and when is it deleted?
Your files are kept in an isolated workspace with a random ID that only you can reach. You choose a retention period between 1 hour and 7 days; it counts from your last activity and all data is deleted automatically when it ends. You can also delete everything immediately in one click.
Which file formats can I upload?
CSV, TSV, TXT, Excel (XLSX, XLS), OpenDocument (ODS), JSON, JSON Lines, XML, HTML tables, Parquet, Feather and Stata. Character encoding and delimiter are detected automatically.
How large can my files be?
You can upload up to 25 MB per file and work with datasets of up to 1 million rows and 3 million cells, with at most 8 datasets at the same time.
Can I automate the steps I repeat in Excel?
Yes. Save the cleaning and transformation steps you applied as a recipe and apply them, in the same order, to next month's file in one click.
Do I need to know SQL?
No. Cleaning, transformation, analysis and charts are all done through forms. The SQL tab is an extra option for those who know it.
Start understanding your data today
Try it right away with a sample dataset or drop your own file. No account, no installation, no cost.
Open DataLab (opens in a new tab)Together with the calculators
Prepare your data in DataLab; use the free calculators on the main site for tax, salary, finance and everyday calculations.